Magnetic Survey
A ground magnetic survey was conducted on the Primary Ridge and “Red Springs” porphyry targets, involving an approx. 2km2 area, using 100 metre line spacing and 20 metre data collection point intervals. This survey covered the same area as the soil sampling program conducted by HEG in early August 2019 (Figure 1), and HEG’s work contributed to the definition of two strong copper soil anomalies. In addition, the Jaxon’s geologists sampled and mapped three K-feldspar mineralized granodiorite porphyry intrusion outcrops all within this area (Figure 1).
Jaxon’s geologists note that the K-feldspar altered mineralized granodiorite is of weaker magnetic feature within stronger magnetic early biotite granodiorite hosting rocks. The main objectives of this survey were to map magnetic highs and lows over the porphyry targets, aiming to locate the low-magnetic K-feldspar altered mineralized granodiorite.
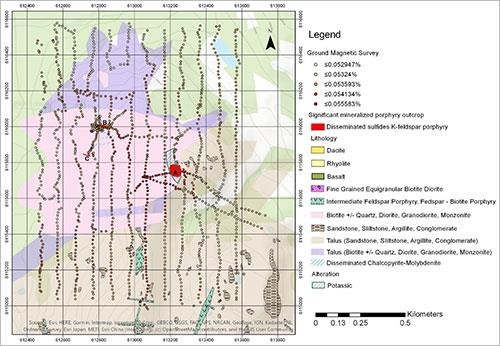
Figure 1: Completed ground magnetic surveying area at Jaxon’s Red Springs Project located in northwestern British Columbia, Canada (A, B and C: three outcrops of disseminated sulfides K-feldspar granodiorite) 2019
A GSM-19 proton magnetometer, manufactured in Canada, was used in the survey. The observed parameter is the total magnetic field strength T. Resulting magnetic images confirm that a large porphyry intrusion body with low magnetic response may exist beneath the Primary Ridge and “Red Springs” porphyry target areas. A series of Reduction to the Pole (RTP) and downward continuation image maps (Figures 2 and 3) of the magnetic anomalies in the survey area were produced using geophysical data processing software, GeoIPAS v3.2 developed by Urumqi Jinwei Map-Character Information and Science & Technology Co. in China.
Figure 2 surface ΔT plane contour map of the magnetic field strength T at the survey area shows four major positive anomalies numbered C-A, C-B, C-C and C-D, in addition to several secondary positive and negative anomalies. Located at the centre of the survey area and running northwest to southeast, C-A is a large and strong positive anomaly and the most significant. The maximum value of △T is 2511.09 nT. There are multiple anomalous centres and large horizontal gradient changes. The 300 metre downward continuation of the magnetic map shows the magnetic anomaly disappearing or being replaced by other non-magnetic rock masses at a depth of 300 metres (Figure 3).
Anomalies C-B in the south and C-C in the southwest also possess multi-centre positive anomalies and both are open ended in the south end. The highest value of △T for anomalies C- B and C-C are 1125.05 nT and 1045.55 nT, respectively. Abnormal widths for both anomalies are narrow and the gradient changes are stable. Magnetic anomalous sources for C-B and C-C are derived from the same source as C-A. The 200 metre upward continuation show that both magnetic anomalies gradually converge and disappear at a depth of 200 metres (Figure 3).
Located in the north of the survey area, the C-D anomaly runs northwest-westward and possesses multi-centres. The highest value of △T is 547.29 nT. This anomaly is relatively wide and the horizontal gradient change is moderate. Compared with the magnetic anomaly C-A, the magnetic anomalous source has weak magnetic properties and is near the surface. The upward continuation shows the anomaly gradually converges and disappears at a depth of 200 metres. The magnetic source is more shallow than that of magnetic anomaly C-A and is derived from a different magnetic source.
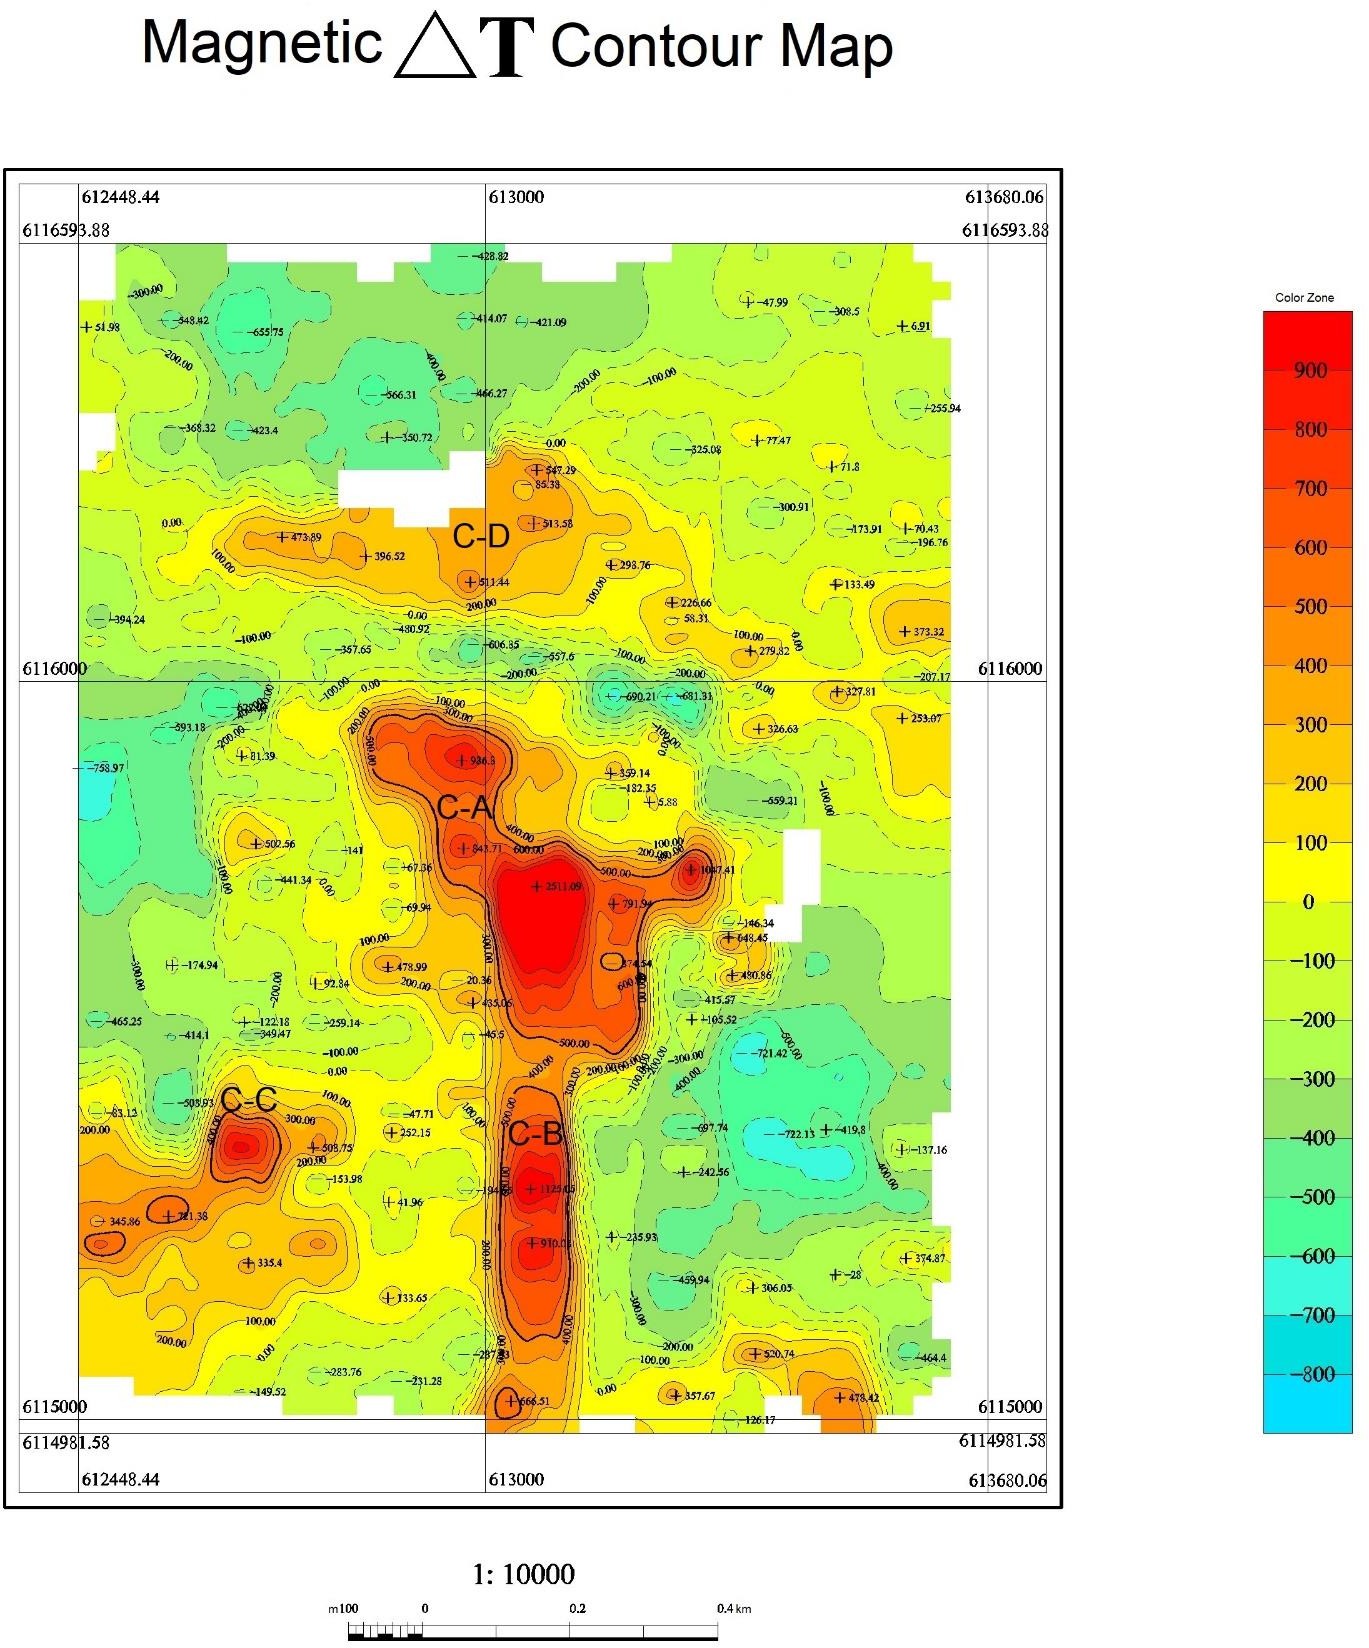
Figure 2: Ground ΔT magnetic anomaly map of Primary Ridge and “Red Springs” porphyry target areas at the Red Springs Project

Figure 3: Downward continuation maps of ground magnetic anomalies at 50m, 100m, 200m and 300m
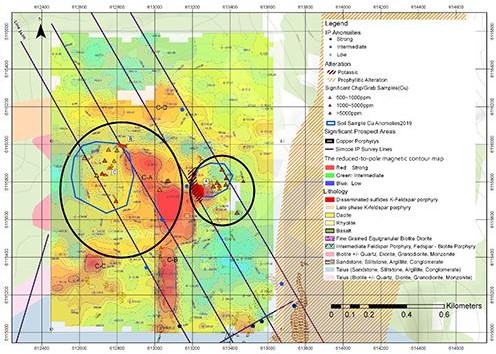
Figure 4: Comprehensive map of magnetic anomaly, soil geochemistry, geology and mineralization at the Red Springs Project
Highlights of the 2019 Ground Magnetic Survey
- Preliminary results reveal the K-feldspar altered mineralized granodiorite porphyritic intrusion (A) is of a weaker magnetic feature within a stronger magnetic anomaly area, involving the early biotite granodiorite hosting rock. This result is consistent with a strongly potassic alteration feature, strong Cu soil anomaly and medium IP chargeability anomaly in the Outcrop A area (Figure 4). The K-feldspar granodiorite dykes (B and C) are also located in a magnetic low and strong Cu soil anomaly area.
- Early phase magnetic high granodiorite is only on the top part at the Primary Ridge and rusted, greater than one km wide and four km long propylitic alteration zone at the Red Springs project area (Figure 5), it indicates that a large altered demagnetised granodiorite porphyry intrusion may lie beneath the magnetic high granodiorite rock. All outcrops of these disseminated sulfide, K-feldspar (altered), vein stockwork granodiorite porphyry intrusion (dyke) are only fringes emanating from the large porphyry intrusion beneath. (Figure 5).
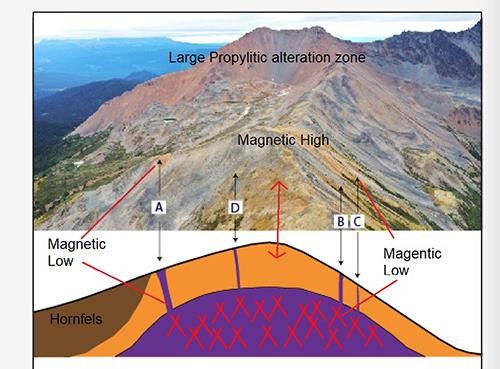
Figure 5: Proposed preliminary 3D mineralization model of the Red Springs Porphyry Project. A, B and C outcrops of K-feldspar granodiorite porphyry intrusion with disseminated chalcopyrite; D, float of K-feldspar granodiorite porphyry intrusion with disseminated chalcopyrite
This magnetic survey work identified the profile and extent of the magnetic low areas at Red Springs. The survey shows the positive magnetic anomaly dissipating between the 200 and 300 metre level, confirming where the porphyry should start to appear. The processed magnetic data has been integrated with the soil geochemistry surveys, IP survey results and other mapping work; and the magnetic survey results support the Company’s interpretation of the other data sets. The 3D geological model will continually evolve as more data is added over the next few months. Jaxon’s team is starting to visualize the porphyries and surrounding structures and the Company is looking forward to using the model to vector in on drill targets for the 2020 season.