Jaxon Reports Preliminary Ground Magnetic Survey Results from Red Springs and Assay Results for K-feldspar Porphyry Outcrop Samples
November 12, 2019, Vancouver, Canada - Jaxon Mining Inc. (“Jaxon” or the “Company”) (TSX.V: JAX, FSE: OU31, OTC: JXMNF) is pleased to announce preliminary ground magnetic survey data processing results and assay results for K-feldspar porphyry granodiorite outcrop samples. The ground magnetic survey was conducted by C2 Mining International Corp (https://www.c2miningcorp.com) who collected high-resolution ground magnetic field data over parts of the Red Springs project area. Resulting magnetic images confirm that a large porphyry intrusion body with low magnetic response may exist beneath the Primary Ridge and “Red Springs” porphyry target areas.
The magnetic survey spans the Primary Ridge and “Red Springs” porphyry targets, involving an approx. 2km2 area, using 100 metre line spacing and 20 metre data collection point intervals. (https://www.jaxonmining.com/news/2019/jaxon-completes-2019-phase-two-field-work-at-red-springs) A GSM-19 proton magnetometer, manufactured in Canada, was used in the survey. The observed parameter is the total magnetic field strength T.
A series of Reduction to the Pole (RTP) and downward continuation image maps (Figures 1 and 2) of the magnetic anomalies in the survey area were produced using geophysical data processing software, GeoIPAS v3.2 developed by Urumqi Jinwei Map-Character Information and Science & Technology Co. in China.
Figure 1 surface ΔT plane contour map of the magnetic field strength T at the survey area shows four major positive anomalies numbered C-A, C-B, C-C and C-D, in addition to several secondary positive and negative anomalies. Located at the centre of the survey area and running northwest to southeast, C-A is a large and strong positive anomaly and the most significant. The maximum value of △T is 2511.09 nT. There are multiple anomalous centres and large horizontal gradient changes. The 300 metre downward continuation of the magnetic map shows the magnetic anomaly disappearing or being replaced by other non-magnetic rock masses at a depth of 300 metres (Figure 2).
Anomalies C-B in the south and C-C in the southwest also possess multi-centre positive anomalies and both are open ended in the south end. The highest value of △T for anomalies C-B and C-C are 1125.05 nT and 1045.55 nT, respectively. Abnormal widths for both anomalies are narrow and the gradient changes are stable. Magnetic anomalous sources for C-B and C-C are derived from the same source as C-A. The 200 metre upward continuation show that both magnetic anomalies gradually converge and disappear at a depth of 200 metres (Figure 2).
Located in the north of the survey area, the C-D anomaly runs northwest-westward and possesses multi-centres. The highest value of △T is 547.29 nT. This anomaly is relatively wide and the horizontal gradient change is moderate. Compared with the magnetic anomaly C-A, the magnetic anomalous source has weak magnetic properties and is near the surface. The upward continuation shows the anomaly gradually converges and disappears at a depth of 200 metres. The magnetic source is more shallow than that of magnetic anomaly C-A and is derived from a different magnetic source.
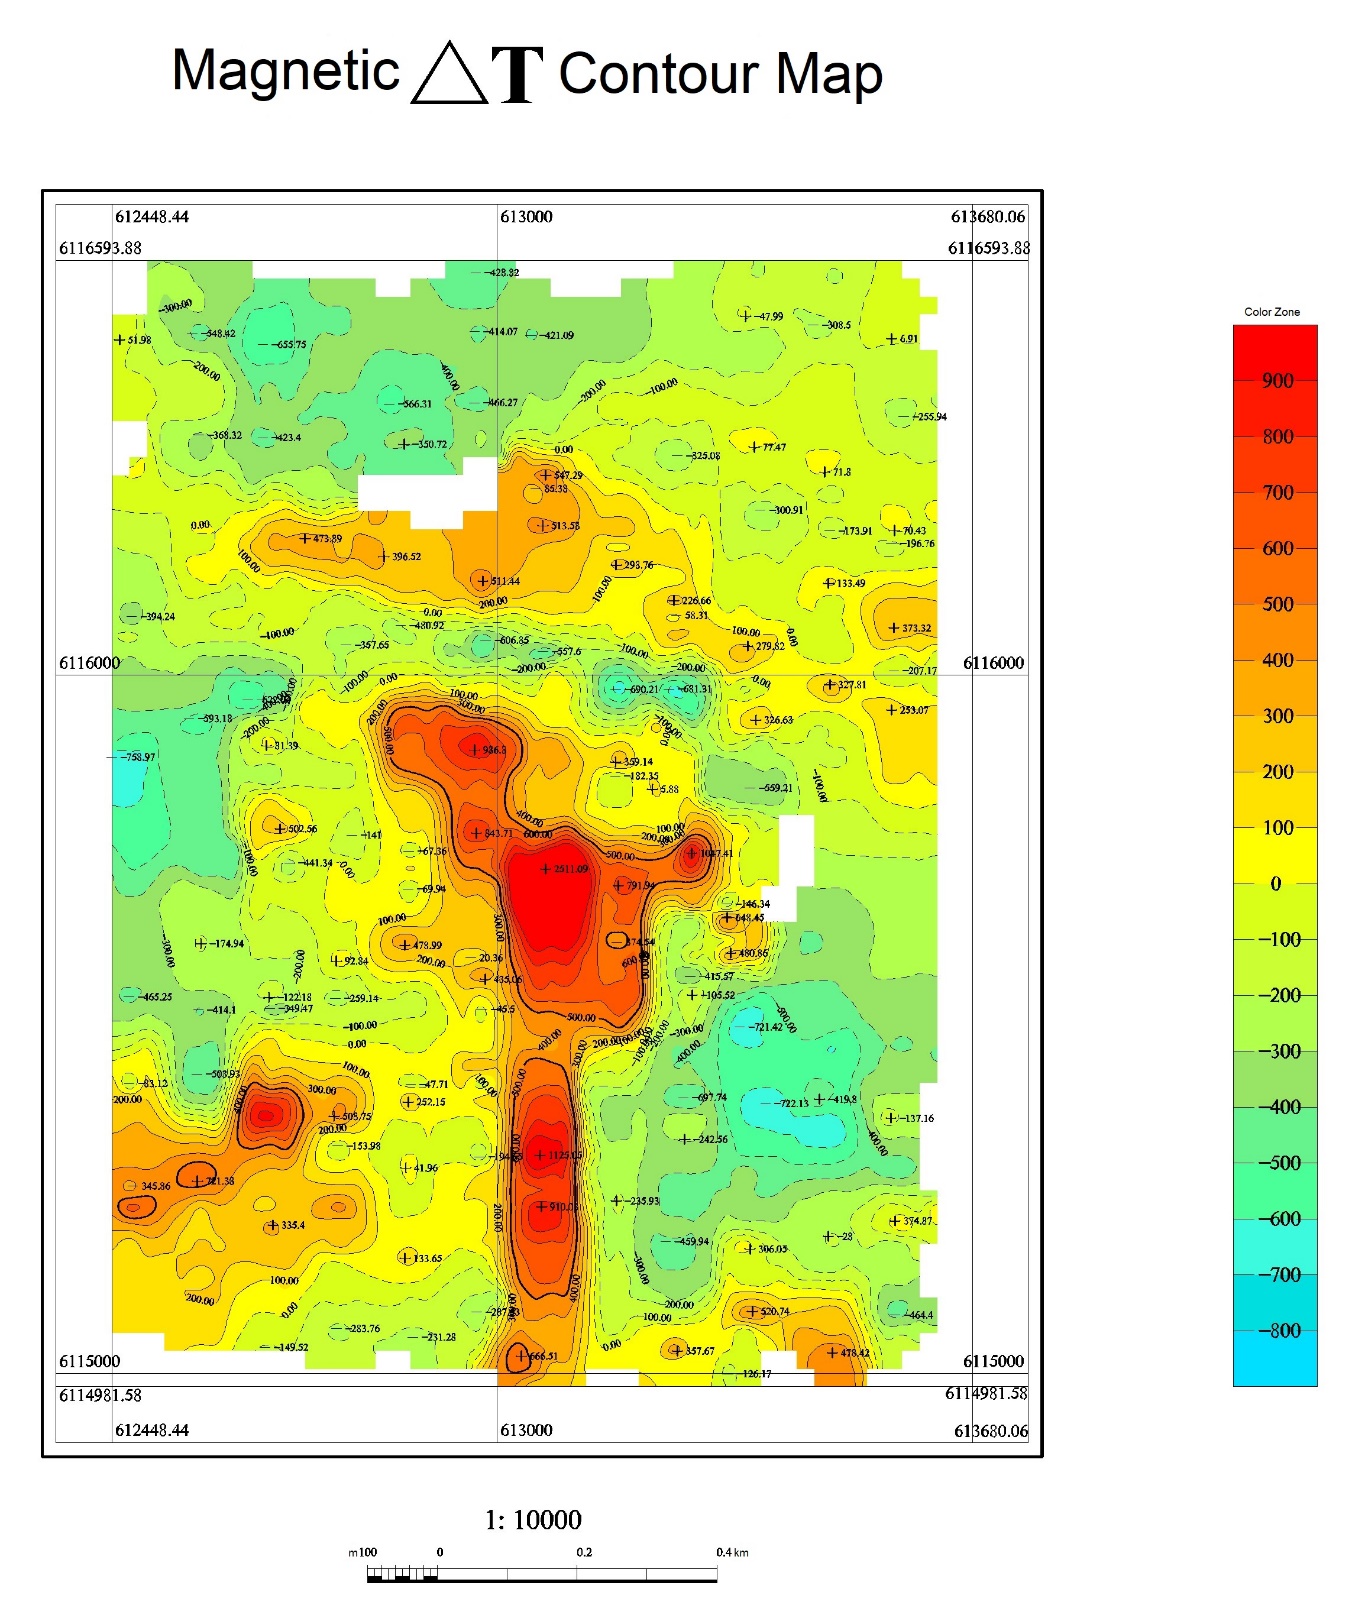
Figure 1: Ground ΔT magnetic anomaly map of Primary Ridge and “Red Springs” porphyry target areas at Red Springs Project

Figure 2: Downward continuation maps of ground magnetic anomalies at 50m, 100m, 200m and 300m
The Company’s geologists have discovered three K-feldspar porphyry intrusion outcrops and collected rock samples from the outcrops at the Red Springs Project area in its 2019 phase 2 field work program. (Figure 3) (https://www.jaxonmining.com/news/2019/jaxon-completes-2019-phase-two-field-work-at-red-springs). Assay results for these samples are listed in Table 1 below:
Table 1. Assay results from three K-feldspar porphyry intrusion outcrops at the Red Springs Project
Sample | IMS-128 | IMS-128 | Easting (m) | Northing (m) | Elevation (m) | Target Area | Rock Type |
Cu | Ag | ||||||
Ppm | ppm | ||||||
A0027062 | 1549.4 | 0.92 | 613342 | 6115764 | 1687 | Red | Altered K- |
A0027063 | 493.1 | 0.51 | 613246 | 6115763 | 1727 | Red Spring | Granodiorite |
A0027064 | 709.8 | 0.59 | 613234 | 6115757 | 1739 | ||
A0027065 | 1286 | 1.46 | 613243 | 6115746 | 1738 | ||
A0027071 | 16640 | 16.66 | 613470 | 6115807 | 1661 | Tourmaline | |
A0027077 | 802.8 | 0.62 | 612738 | 6115840 | 1601 | Primary | K-feldspar |
A0027079 | 583.2 | 0.57 | 612755 | 6115875 | 1599 | ||
A0027080 | 665 | 0.54 | 612755 | 6115875 | 1599 | ||
A0027081 | 1920.7 | 1.75 | 612764 | 6115878 | 1599 | ||
A0027085 | 507.2 | 0.77 | 612784 | 6115915 | 1639 | Primary | K-feldspar |
A0027086 | 1399.4 | 1.29 | 612784 | 6115913 | 1639 | ||
A0027087 | 908.7 | 0.8 | 612784 | 6115913 | 1639 | ||
A0027090 | 1074 | 0.71 | 612845 | 6115990 | 1672 | ||
A0027091 | 923.6 | 0.63 | 612845 | 6115990 | 1672 | ||
A0027092 | 1891 | 1.84 | 612845 | 6115990 | 1672 | ||
A0027075 | 1648 | 1.11 | 612845 | 6115990 | 1672 |
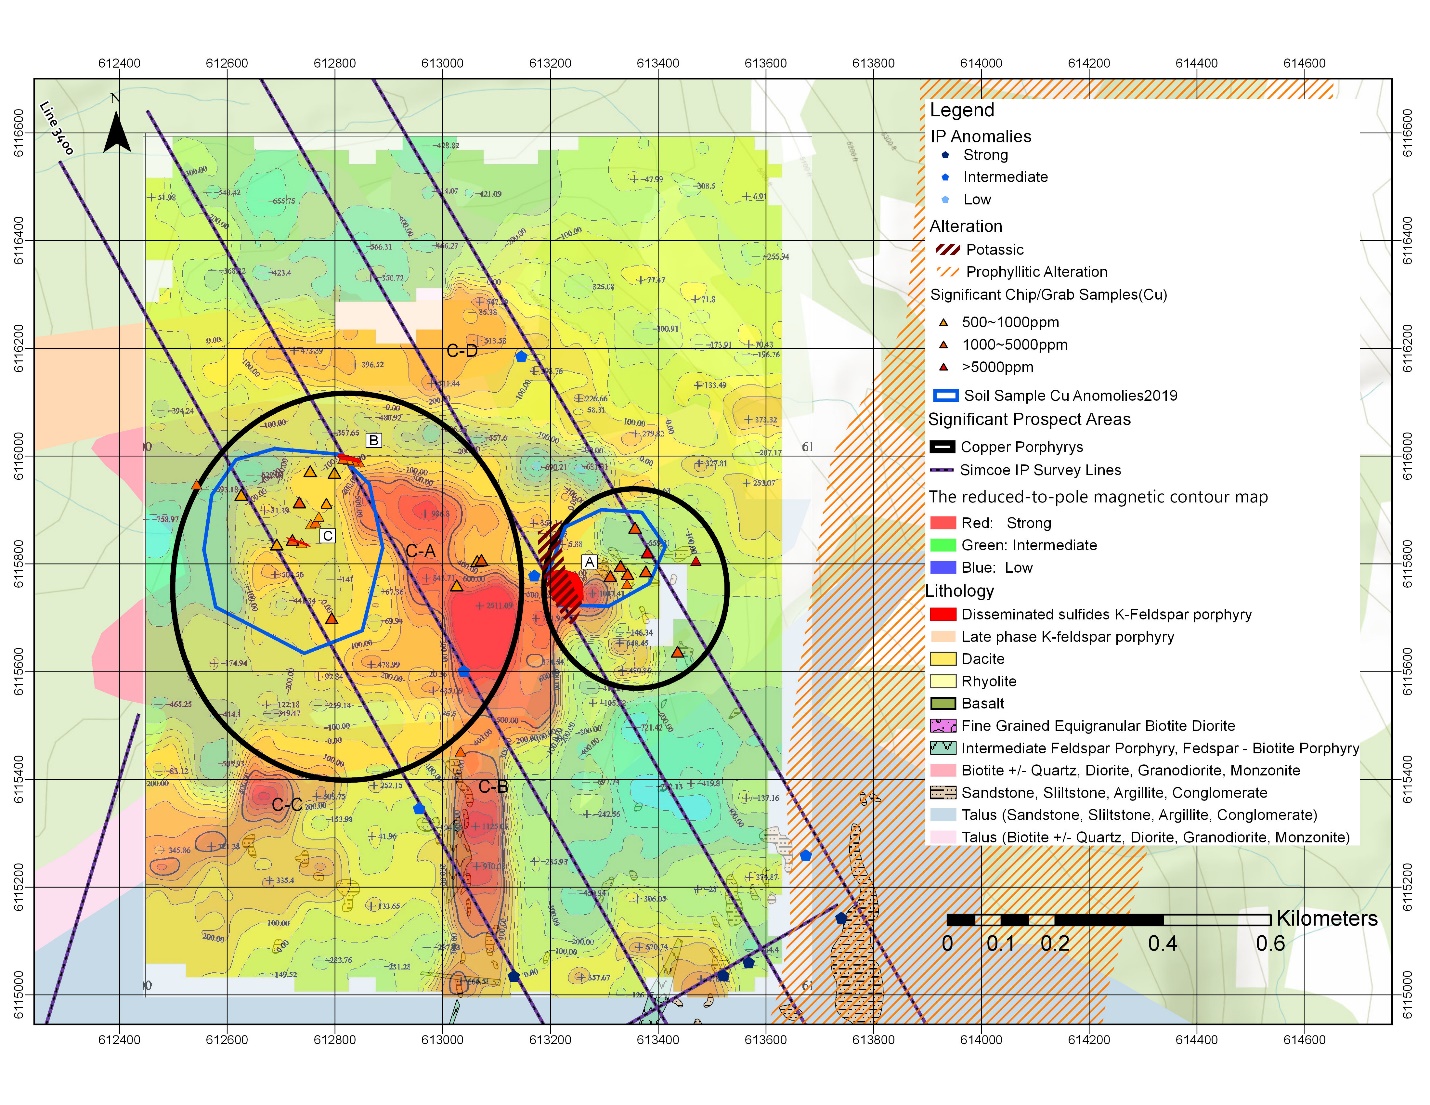
Figure 3: Comprehensive map of magnetic anomaly, soil geochemistry, geology and mineralization at the Red Springs Project
Highlights of the 2019 Ground Magnetic Survey and K-feldspar Porphyry Outcrop Samples
- Preliminary results reveal the K-feldspar altered mineralized granodiorite porphyritic intrusion (A) is of a weaker magnetic feature within a stronger magnetic anomaly area, involving the early biotite granodiorite hosting rock. This result is consistent with a strongly potassic alteration feature, strong Cu soil anomaly and medium IP chargeability anomaly in the Outcrop A area (Figure 3). The K-feldspar granodiorite dykes (B and C) are also located in a magnetic low and strong Cu soil anomaly area.
- Cu assay results from all K-feldspar porphyry outcrop samples are from 500-2,000 ppm. However, Cu assays from mineralized hornfels tourmaline breccia vein in the outer contact zone can be up to 16,640 ppm.
- Early phase magnetic high granodiorite is only on the top part at the Primary Ridge and “Red Springs” porphyry target areas; considering a large scale, semi-circular, surface rusted, greater than one km wide and four km long propylitic alteration zone at the Red Springs project area (Figure 4), it indicates that a large altered demagnetised granodiorite porphyry intrusion may lie beneath the magnetic high granodiorite rock. All outcrops of these disseminated sulfide, K-feldspar (altered), vein stockwork granodiorite porphyry intrusion (dyke) are only fringes emanating from the large porphyry intrusion beneath. (Figure 4)
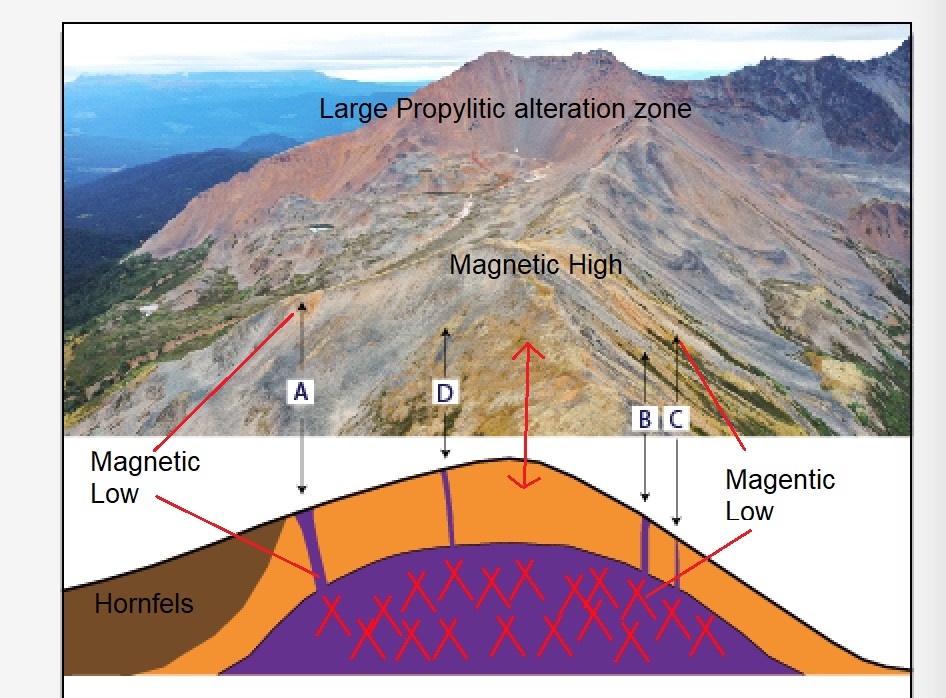
Figure 4: Proposed preliminary 3D mineralization model of the Red Springs Porphyry Project. A, B and C, outcrops of K-feldspar granodiorite porphyry intrusion with disseminated chalcopyrite, D, float of K-feldspar granodiorite porphyry intrusion with disseminated chalcopyrite
Mr. John King Burns, CEO and Chairman of the Board commented, “We are pleased with the magnetic data processing results. This work has allowed us to identify the profile and extent of the magnetic low areas at Red Springs. The survey shows the positive magnetic anomaly dissipating between the 200 and 300 metre level; confirming where the porphyry should start to appear. The processed magnetic data has been integrated with the soil geochemistry surveys, IP survey results and other mapping work; and the magnetic survey results support our interpretation of the other data sets. Our 3D geological model will continually evolve as more data is added over the next few months. We are starting to visualize the porphyries and surrounding structures and we are looking forward to using the model to vector in on our drill targets for the 2020 season.”
Sample Preparation and Analyses
Chip and prospecting samples were collected in the field by experienced, professional prospectors and geological staff who selected hand samples from outcrop, chip samples, boulder and talus debris samples suitable for slabbing by rock saw. The samples were numbered, described and located in the field for follow-up. Numbered rock samples tags were placed inside each bag, securely closed for transport to the Company’s secure cold storage locked facility in Smithers, B.C. Representative sample slabs were cut from large specimens and halved rock samples so that portions of select samples could be saved for the Company’s rock library, descriptive purposes and petrographic study. MS Analytical of Langley, B.C. received the Rice Bag shipments after secure transport from Smithers. Samples were prepared by crushing, grinding and pulverizing to a pulp with barren material washing between each sample at the crush and pulverizing stages. Then 20 g of pulp was used for the (IMS-117 code) ultra-trace level ICP/MS AR digestion method, and four acid 0.2 g ore grade ICP – AES method (ICP-240) and for the overlimit gold the FAS-415 method of 30 g fusion Gravimetric method was used to report gold ASSAYS. Overlimit silver is determined by Fire ASSAY 415 method. Laboratory standards and QA – QC is monitored by the Company.
Qualified Person
Yingting (Tony) Guo, P.Geo., President and Chief Geologist for Jaxon Mining Inc., a Qualified Person as defined by National Instrument 43-101, has reviewed and prepared the scientific and technical information and verified the data supporting such scientific and technical information contained in this news release.
About Jaxon Mining Inc.
Jaxon is a precious and base metals exploration company with a regional focus on Western Canada. The Company is currently focused on advancing its Red Springs Project in north-central British Columbia.
ON BEHALF OF THE BOARD OF DIRECTORS
JAXON MINING INC.
“John King Burns”
John King Burns, Chairman
For more information please contact:
Investor Relations
Kaye Wynn Consulting
T: 604-558-2630
TF: 1-888-280-8128
E: info@kayewynn.com
Freeform Communications
T: 604-243-0499
E: enquiries@freeform.com
Corporate
T: 604-398-5394
E: info@jaxonmining.com
www.jaxonmining.com
This news release may contain forward-looking information, which is not comprised of historical facts. Forward-looking information involves risks, uncertainties and other factors that could cause actual events, results, performance, prospects and opportunities to differ materially from those expressed or implied by such forward-looking information. Forward-looking information in this news release may include, but is not limited to, the Company's objectives, goals or future plans. Factors that could cause actual results to differ materially from such forward-looking information include, but are not limited to, those risks set out in the Company's public documents filed on SEDAR. Although the Company believes that the assumptions and factors used in preparing the forward-looking information in this news release are reasonable, undue reliance should not be placed on such information, which only applies as of the date of this news release, and no assurance can be given that such events will occur in the disclosed time frames, or at all. The Company disclaims any intention or obligation to update or revise any forward-looking information, whether as a result of new information, future events or otherwise, other than as required by law. Neither TSX Venture exchange nor its Regulations Services Provider (as that term is defined in the policies of the TSX Venture Exchange) accepts responsibility for the adequacy or accuracy of this release.